I read Side Effect’s article on debouncing with Swift concurrency and wanted to see how much work its approach saved: keep one worker alive for a burst of events instead of creating a task for every input. A burst is a run of values before a pause, such as the keystrokes you type into a search field.
Reusing the task brought the cost of accepting a value from 798 ns to 216 ns in my benchmark. The package I eventually built reached 16 ns. To understand the remaining cost, I had to look at Swift’s type metadata, generic specialization, and where the lock sat in memory.
What surprised me
- The lock swap saved only about 10 ns. Most of the work in the repeated-input path remained.
- A concrete type can still need runtime layout information. Knowing the input was an
Intdid not tell the compiler howContinuousClock.Instantwas laid out. Later, cross-module optimization barely affected the original worker-based version but gave my revised prototype roughly nine times the throughput. - Moving the lock helped the debouncer and hurt the lock benchmark. With competing senders, the state update got faster when I moved the lock farther from the state.
- Callbacks did not arrive 50× sooner. The headline measures synchronous input cost in a dense burst. Callback lateness stayed on the millisecond scale, and paced input showed a much smaller resource benefit.
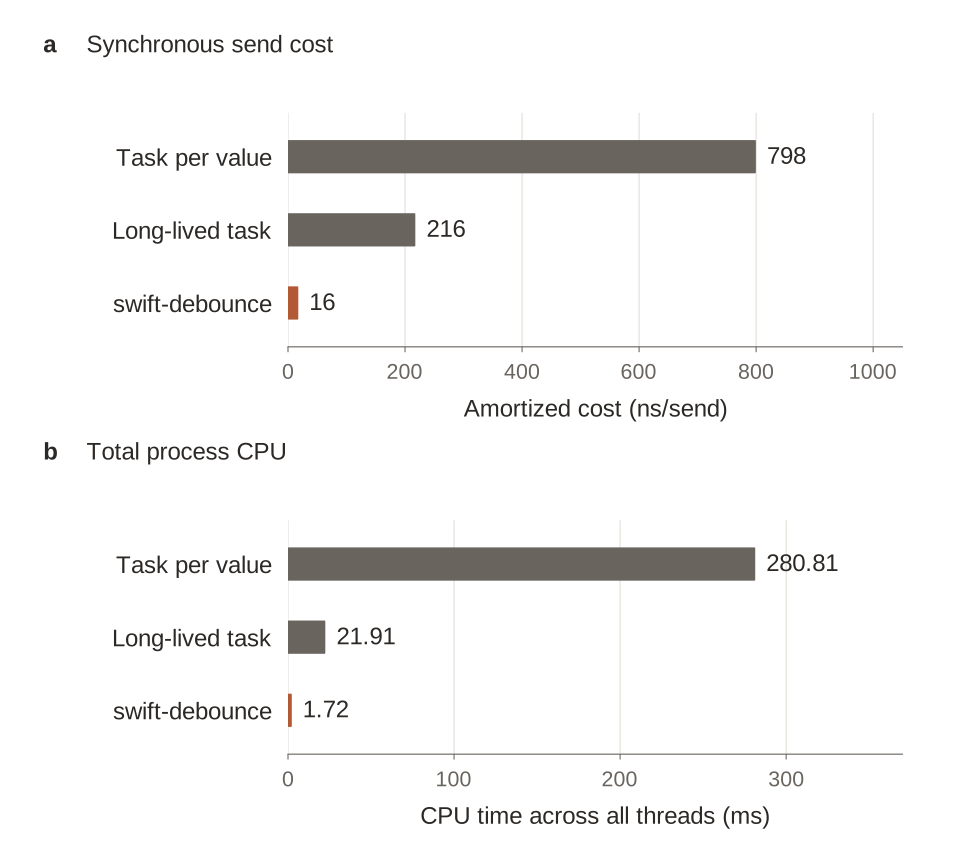
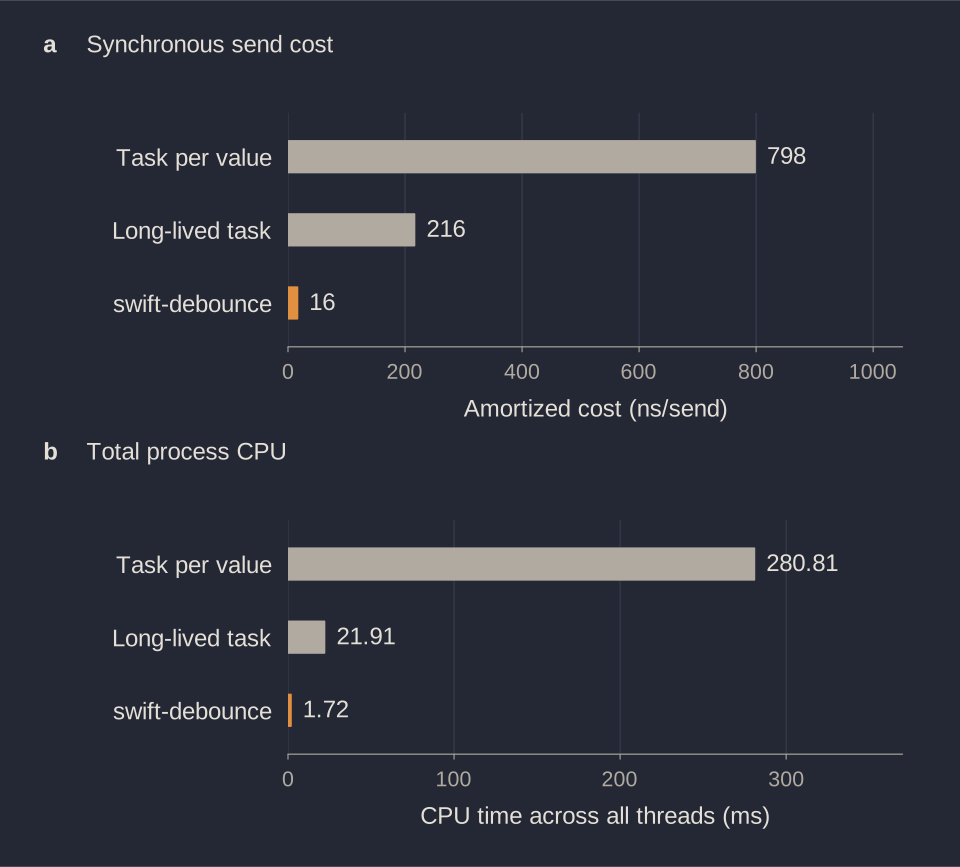
View data: Final implementation comparison
| Implementation | Amortized send cost | Send-loop wall time | Total process CPU |
|---|---|---|---|
| Task per value | 798 ns | 79.82 ms | 280.81 ms |
| Long-lived task | 216 ns | 21.61 ms | 21.91 ms |
| Package | 16 ns | 1.57 ms | 1.72 ms |
100,000 integer values, one sender, 10 ms quiet period; median of 15 rounds on an M1 Max, macOS 26.7.1, Swift 6.4, release. The 50× ratio is 798 ÷ 16. CPU includes output and a settling period. Scenario results.
The chart compares complete implementations. I used different workloads for the clock, compiler, and storage experiments below, so those results do not measure each change’s share of the 50× gain.
Benchmark environment and comparison limits
The code and saved results come from swift-debounce at revision 990cf04. The measurements were recorded on October 13, 2026, on an M1 Max with 10 CPU cores, macOS 26.7.1, and Swift 6.4, using release builds.
Send cost is the input loop’s wall time divided by its call count. Total process CPU covers a longer window, including output and 30 ms for cancelled tasks to settle. My benchmark copies of the two implementations include atomic task and wakeup counters; the package has no matching instrumentation. The final harness enables cross-module optimization for its References target too.
The package also runs actions one at a time, while the original worker-based version allows them to overlap. This burst test checks that the final value arrives once.
One task per burst still left 216 ns to explain
Trailing debounce waits for a quiet period, then delivers the latest value. In a search field, that means replacing the pending query while typing continues.
The straightforward implementation cancels the previous task and starts another. Inside the lock, the task-per-value version looks like this:
task?.cancel()
task = Task {
    do {
        try await Task.sleep(for: dueTime)
        await output(value)
    } catch {
        // Cancellation ends this task without delivering a value.
    }
}
Most tasks in a dense burst will deliver nothing, but creating and cancelling them still takes CPU time. Cancellation is cooperative: the sleeping task has to respond to the request.
Side Effect’s alternative stores the latest value and deadline outside the task. The first input starts a worker; later inputs update that shared state. When the worker wakes, it checks the deadline and sleeps again if an input moved it forward.
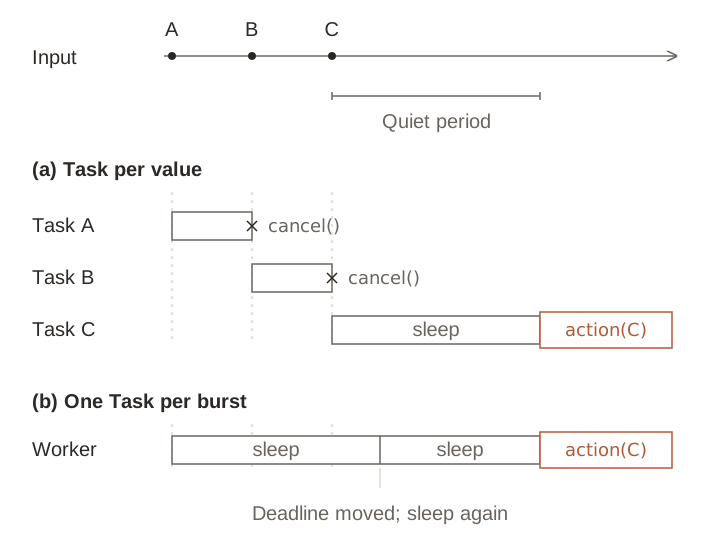
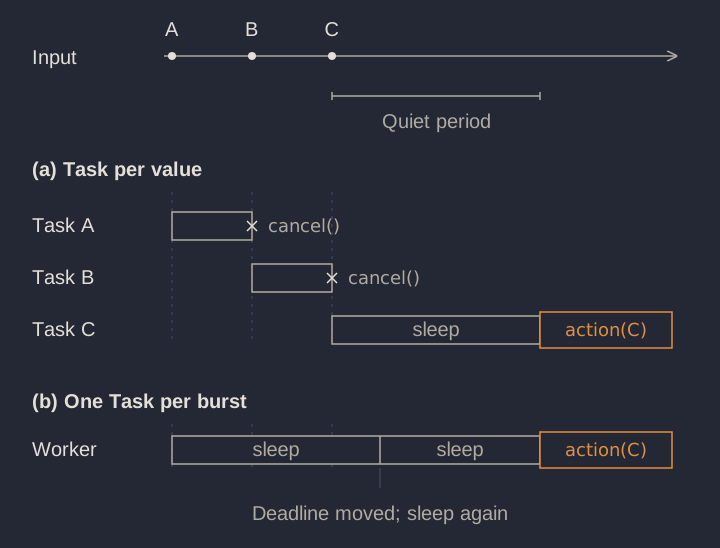
The same input stream, using one task per value or one worker per burst. A worker can wake more than once before delivering the latest value.
An input does not have to wake the worker to extend the deadline. Most calls now read the clock and update state under a lock, without creating another task.
Reusing the worker cut input cost by about 3.7× and total CPU by about 13×. The benchmark counters recorded 100,000 tasks for the first strategy and one for the second. The larger CPU reduction is consistent with avoiding work outside the synchronous calls, including cancellation cleanup.
Compare the two task strategies and inspect the worker
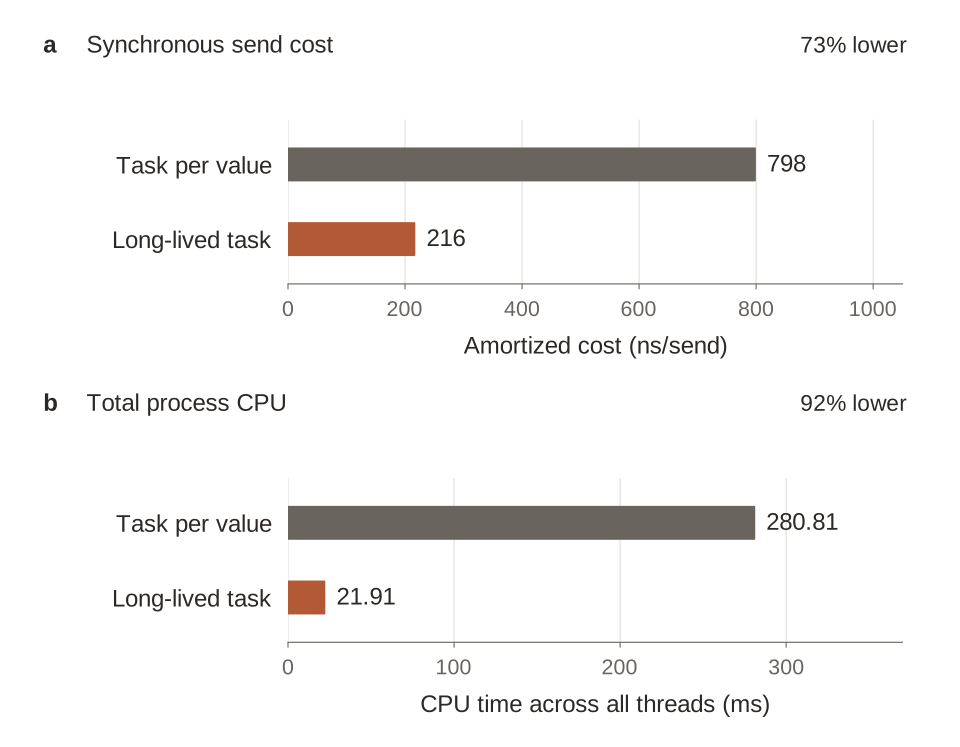
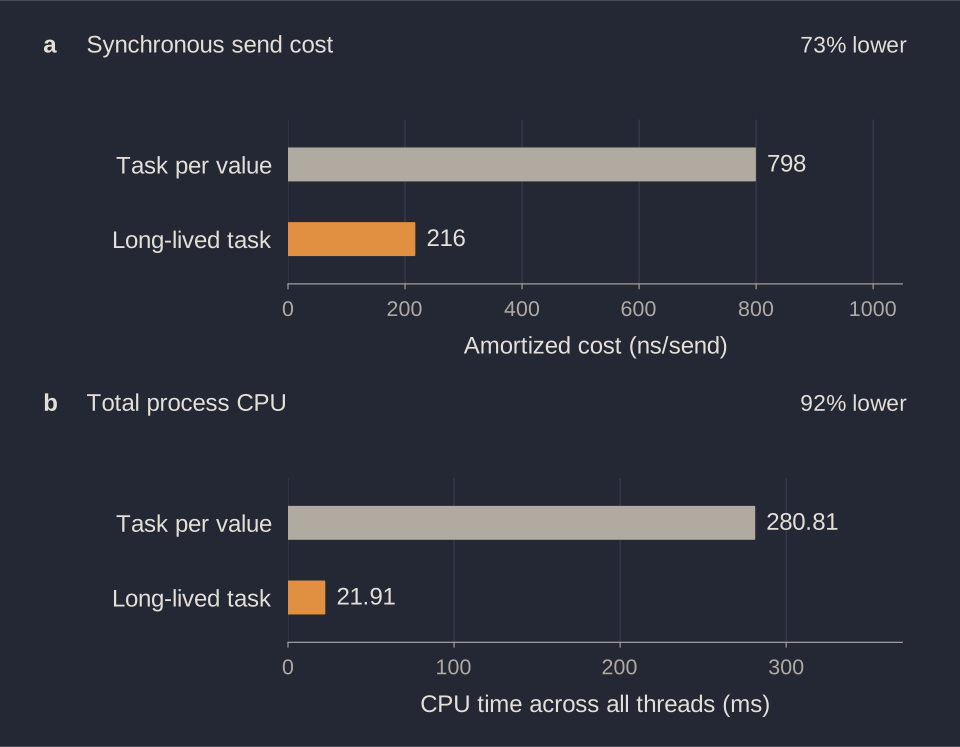
View data: Task reuse comparison
| Implementation | Amortized synchronous send cost | Total process CPU |
|---|---|---|
| Task per value | 798 ns | 280.81 ms |
| Long-lived task | 216 ns | 21.91 ms |
The same 100,000-value workload as the opening chart. Median of 15 rounds; send cost covers the input loop, while CPU also includes delivery and settling.
The emit method asks the state machine whether it needs a new worker. During an existing burst, the call stops at the guard. The worker follows deadline changes until the state machine returns a value to deliver.
public func emit(value: T) {
    let (shouldStartWorker, initialDeadline) = stateMachine.apply { machine in
        machine.newValue(value)
    }

    guard shouldStartWorker else {
        return
    }

    let worker = Task { [stateMachine, output] in
        var deadline = initialDeadline

        while true {
            try? await Task.sleep(until: deadline, clock: .continuous)

            let nextStep = stateMachine.apply { machine in
                machine.sleepIsOver()
            }

            switch nextStep {
            case .finishDebouncing(let latestValue):
                await output(latestValue)
                return
            case .continueDebouncing(let newDueTime):
                deadline = newDueTime
            }
        }
    }

    task.set(stored: worker)
}
The worker-based version still took 216 ns to accept a value. Every call acquired a lock, so I looked there next.
Replacing the lock saved about ten nanoseconds
Side Effect’s worker-based implementation uses NSRecursiveLock. I compared it with os_unfair_lock, first around a counter increment, then around the complete emit method.
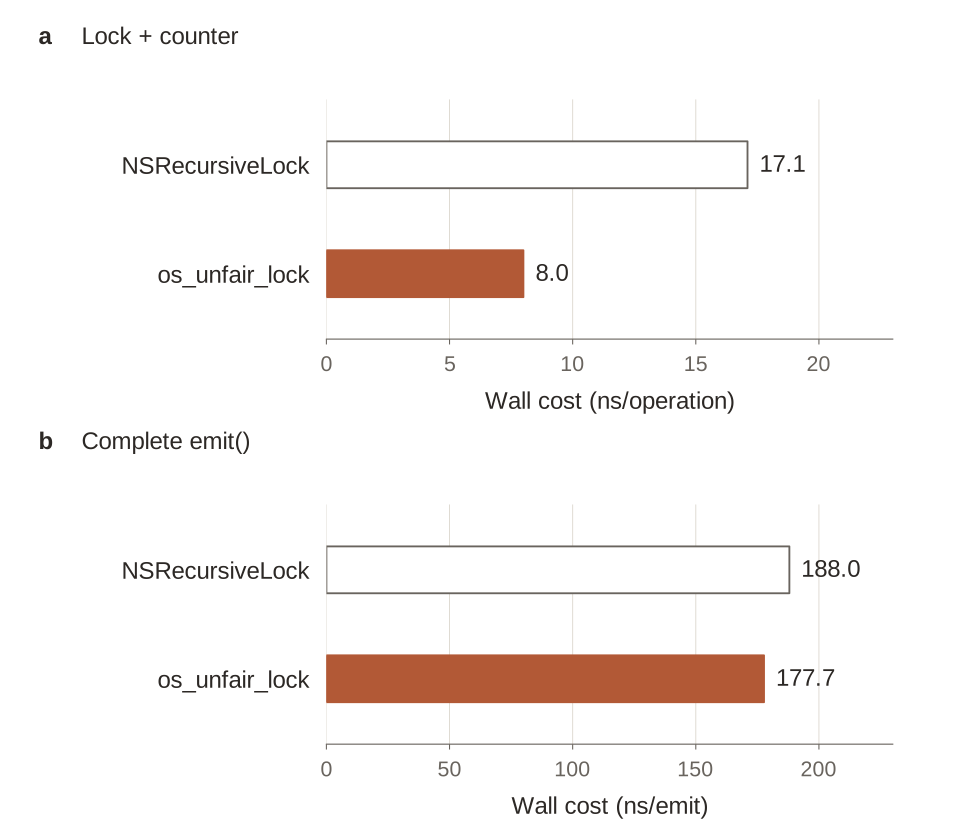
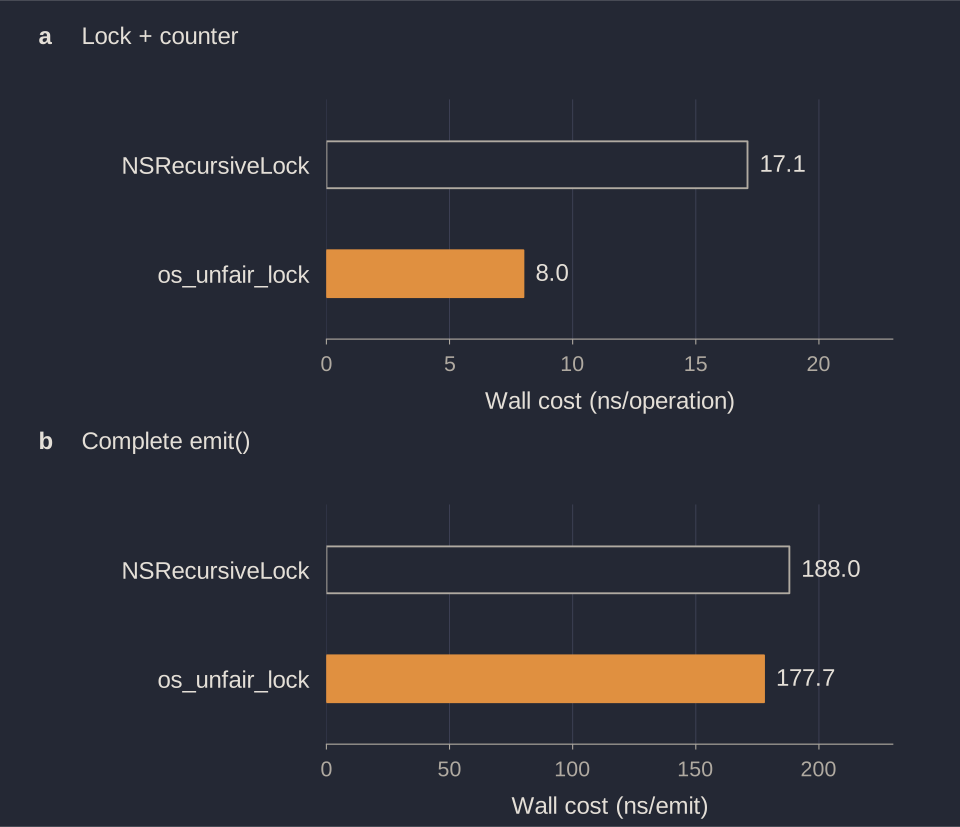
View data: Lock replacement comparison
| Operation, one thread | NSRecursiveLock version | os_unfair_lock variant |
|---|---|---|
| Lock, increment a counter, unlock | 17.1 ns | 8.0 ns |
| Complete emit method | 188.0 ns | 177.7 ns |
Earlier prototype experiment, with one million emits for the full-method comparison. Its 188 ns baseline belongs to a separate workload from the 216 ns result above.
The isolated operation fell from 17.1 to 8.0 ns. The complete method fell from 188.0 to 177.7 ns: a 10.3 ns saving, or about 5.5%.
The lock change mattered more to CPU usage under contention, but it did little to explain the single-thread result. I moved on to the clock read and state update around the lock.
How the lock swap behaved with eight senders
With eight threads sending 100,000 values each, the NSRecursiveLock version used 2,551.5 CPU ns per emit and recorded 33,048 context switches. The unfair-lock variant used 1,384.4 CPU ns and recorded 13,924 switches. Wall time per emit moved from 376.6 to 342.1 ns.
CPU usage fell much more than elapsed time. These are aggregate costs from the same prototype experiment, rather than individual-call latency measurements.
A concrete type can still have an unknown layout
When I profiled the state update, I found these names:
type metadata accessor for ContinuousClock.Instant
swift_getGenericMetadata
swift_getTupleTypeMetadata
The deadline was a ContinuousClock.Instant, a concrete Swift type. Why would updating it involve runtime layout information?
With library evolution, a library can change the stored representation of a non-frozen value type without breaking existing clients. Client code therefore cannot assume a fixed size or layout. A type can have a concrete name while its representation remains opaque across that boundary. @frozen publishes stronger layout guarantees.
The upstream declaration of Instant has no @frozen attribute. Side Effect’s state machine stores the instant inside an enum alongside the input value:
struct DebounceStateMachine<T> {
    enum State {
        case idle
        case debouncing(
            value: T,
            dueTime: ContinuousClock.Instant,
            isValueDuringSleep: Bool
        )
    }

    // Other members omitted.
}
Each new input replaces the .debouncing payload and returns the deadline in a tuple. To perform that update, generated code must locate the fields, handle the old value, and copy in the new one.
Swift’s type metadata points to a value witness table containing layout information and operations for copying, moving, and destroying values. Code that cannot assume a fixed representation can use those operations. This is different from a protocol witness table, which supplies implementations of protocol requirements. The Swift ABI documentation describes the relationship.
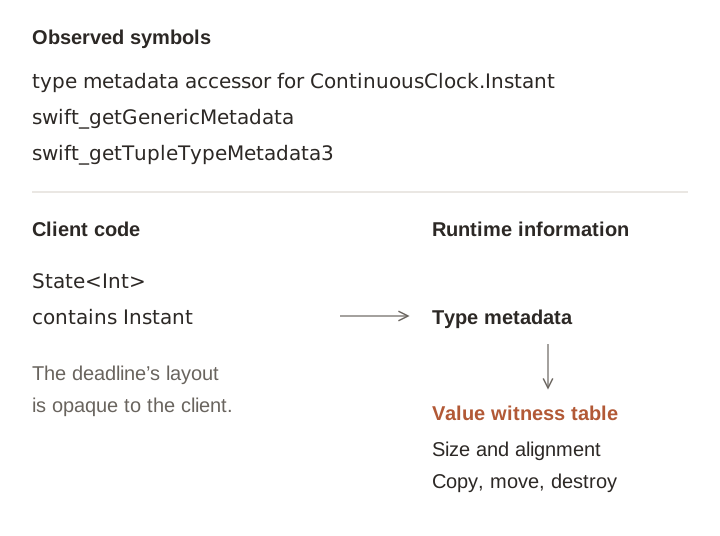
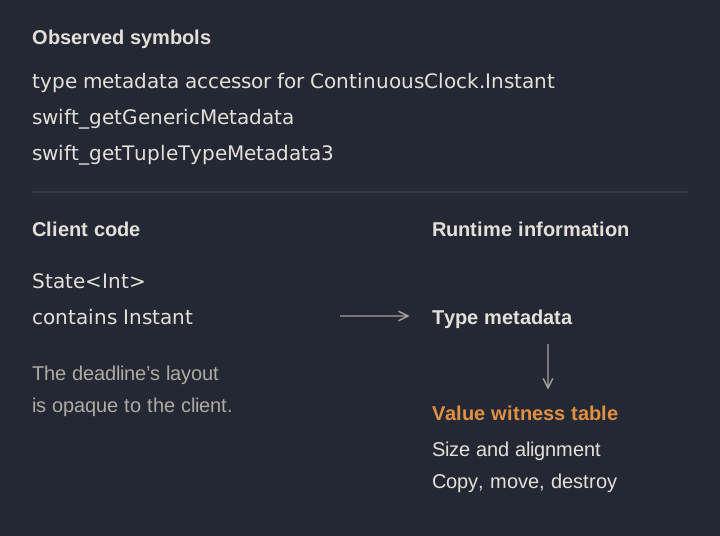
Selected profile symbols alongside the layout mechanism they led me to investigate. The diagram is conceptual; the symbol list does not establish a call chain or timing shares.
Knowing T == Int removes uncertainty about the input payload; it does not expose the separate Instant representation. The surrounding enum and tuple depend on the layouts of their fields too, including padding and alignment.
The profile showed runtime metadata work, but it did not tell me how much of the send cost that work accounted for.
Reproduce the profile and inspect the state update
From the swift-debounce repository root, the benchmark’s profile mode keeps the original worker-based version busy while macOS sample records its stacks:
cd Benchmarks
swift build -c release
.build/release/Locks profile 10 &
sample "$!" 5 1 -file debounce-sample.txt
The harness runs for 10 seconds. $! is its process ID; sample records stacks every millisecond for five seconds and writes them to debounce-sample.txt.
The saved profile contains these selected symbols. OptimizedDebounce was the name of the original worker-based version in that experiment:
DebounceStateMachine.newValue(_:)
OptimizedDebounce.emit(value:)
type metadata accessor for ContinuousClock.Instant
static ContinuousClock.now.getter
ContinuousClock.Instant.advanced(by:)
static Duration.+ infix(_:_:)
__swift_memcpy16_8
__swift_instantiateGenericMetadata
swift_getGenericMetadata
swift_getTupleTypeMetadata3
swift_getTupleTypeMetadata
The newValue method reads the clock, replaces the enum payload, and returns the new deadline:
/// Returns whether to start a task, along with the latest deadline.
mutating func newValue(_ value: T) -> (Bool, ContinuousClock.Instant) {
    let dueTime = ContinuousClock.now + duration

    switch state {
    case .idle:
        state = .debouncing(
            value: value,
            dueTime: dueTime,
            isValueDuringSleep: false
        )
        return (true, dueTime)
    case .debouncing:
        state = .debouncing(
            value: value,
            dueTime: dueTime,
            isValueDuringSleep: true
        )
        return (false, dueTime)
    }
}
The upstream declaration of Instant contains a Duration field and has no @frozen attribute. That source illustrates the layout contract, though I have not established that it matches the Apple Swift 6.4 binary used for these measurements.
Metadata access does not imply a fresh allocation or a boxed deadline on every send. Swift can reuse metadata while code continues to consult it. Likewise, the observed __swift_memcpy16_8 symbol alone does not identify a particular value-witness call chain.
The clock read was another cost
I also measured the clock loops. The ContinuousClock.now loop took 28.9 ns per iteration; the mach_continuous_time() loop took 5.0 ns.
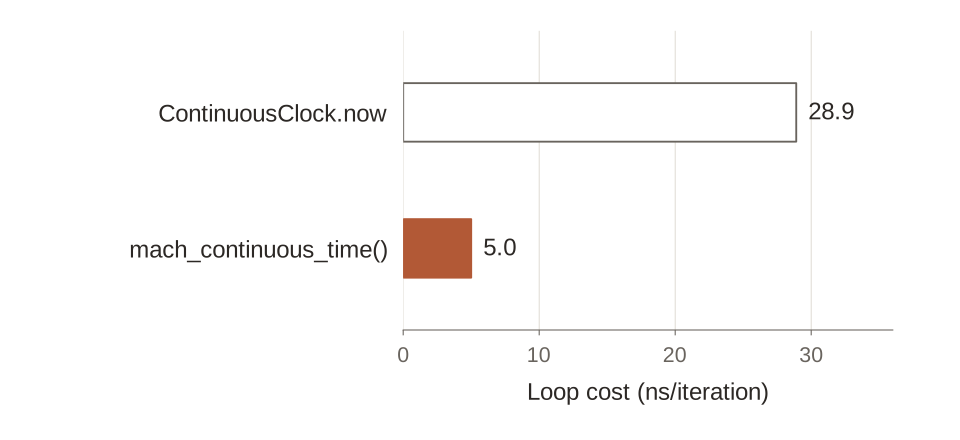
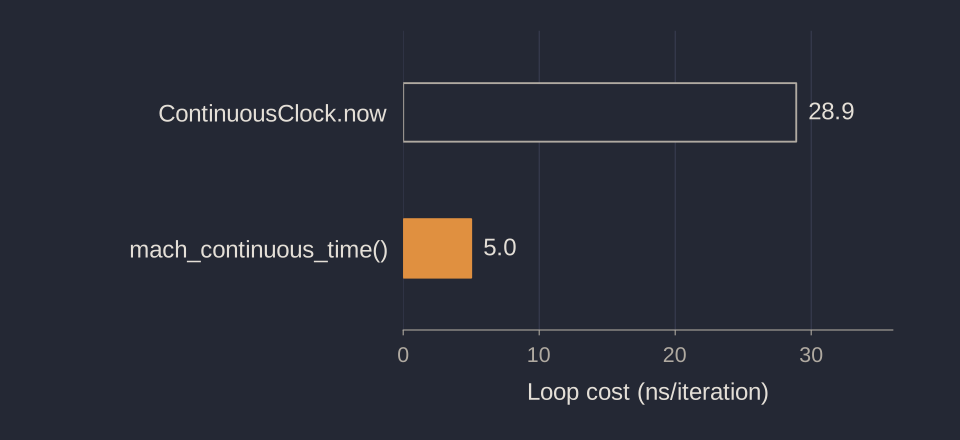
Clock benchmark: median of seven single-thread runs, five million iterations after warm-up. The loops consume their results differently: one calls blackHole for each instant, the other accumulates integer readings. These numbers include that work.
I changed the internal deadline to UInt64 ticks. That gave the state a known integer representation and let the Darwin implementation read time through mach_continuous_time().
Ticks are not necessarily nanoseconds. The package converts the configured interval to ticks once during initialization, keeping that conversion out of send. The worker converts the remaining ticks to nanoseconds when it prepares to sleep.
Read the clock wrapper
The wrapper returns continuous-time ticks on Darwin. Its other supported branch reads CLOCK_BOOTTIME and returns nanoseconds.
@usableFromInline
enum _MonotonicClock {
    @inlinable
    @inline(__always)
    static func now() -> UInt64 {
        #if canImport(Darwin)
        return mach_continuous_time()
        #else
        var time = timespec()
        clock_gettime(CLOCK_BOOTTIME, &time)

        let secondsInNanoseconds = UInt64(time.tv_sec) &* 1_000_000_000
        return secondsInNanoseconds &+ UInt64(time.tv_nsec)
        #endif
    }
}
I changed both how I read the clock and how I stored deadlines. These measurements do not isolate the saving from replacing Instant. The next profile still showed metadata work, this time around the generic input value.
The same compiler flag helped one implementation and barely changed another
The deadline was now an integer; the pending input was still an Optional<Value>. Metadata symbols for that optional appeared in the revised prototype’s profile. The caller might know that Value was Int, while a generic method compiled in another module still had to support any permitted payload.
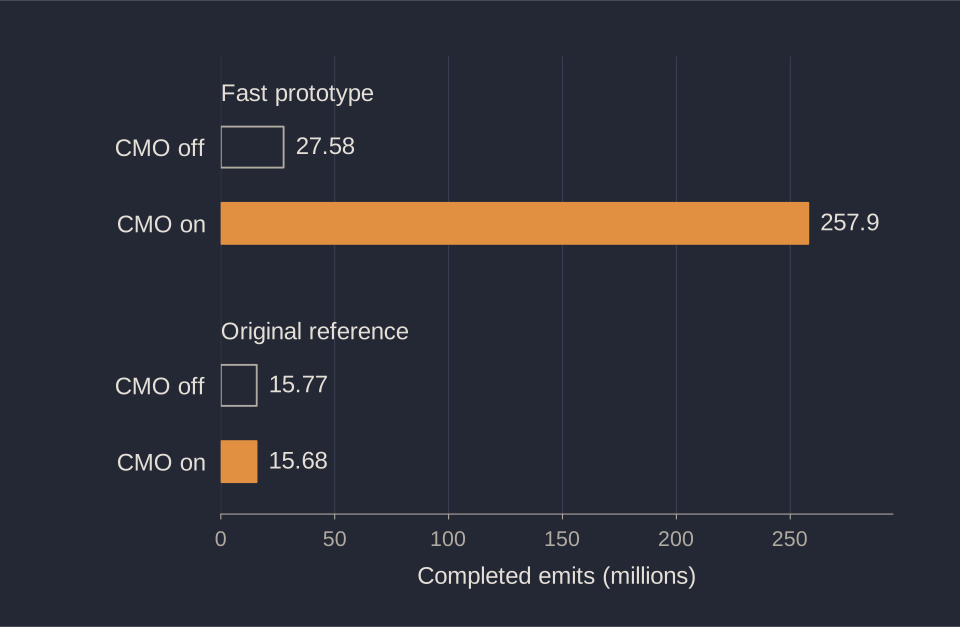
I tried -cross-module-optimization again. It had barely affected the original worker-based version. This time the revised prototype completed about 9.35× as many emits:
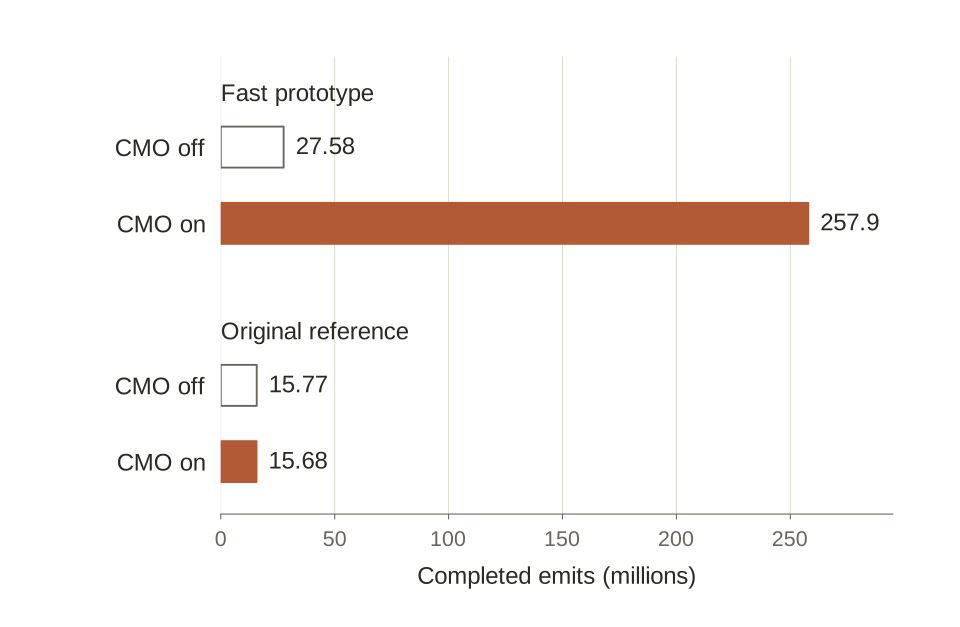
View data: Cross-module optimization comparison
| Historical implementation | CMO off, emits | CMO on, emits |
|---|---|---|
| Fast prototype | 27,580,000 | 257,900,000 |
| Original worker-based version | 15,770,000 | 15,680,000 |
Saved CMO experiment: one listed run per configuration, targeting three seconds. Counts measure throughput, with time checked between batches of 10,000 emits. A 3,600-second quiet period kept callback delivery out of the workload.
Similar metadata symbols appeared in both profiles, but the implementations responded differently to optimization. CMO could not change the external Instant layout contract. After switching to integer deadlines, I saw a large throughput increase when I enabled CMO, which made specialization of the remaining generic state worth investigating.
Letting the optimizer use Value == Int
Specialization creates a version of generic code for a concrete type. For Debouncer<Int>, that can replace generic value handling with operations for Int and Optional<Int>.
Inlining puts a function’s body at its call site. It can expose more opportunities to optimize. The compiler can also specialize a function without inlining it, leaving a call to the specialized version.
The package uses @inlinable to make its input-path bodies available to importing modules. The compiler can then specialize or inline the code, but the attribute does not force either choice. CMO can also provide visibility without the attribute. These are the mechanisms described in SE-0193.
The public method shows the path I wanted the optimizer to see:
@inlinable
public func send(_ value: Value) {
    let now = _MonotonicClock.now()

    storage.withLock { state in
        let shouldStartWorker = state.machine.send(value, now: now)

        if shouldStartWorker {
            core.startWorker(&state)
        }
    }
}
The optimizer also needs to see through storage.withLock into the state machine, where trailingValue: Value? gets replaced. Exposing send alone leaves that generic operation hidden behind a call.
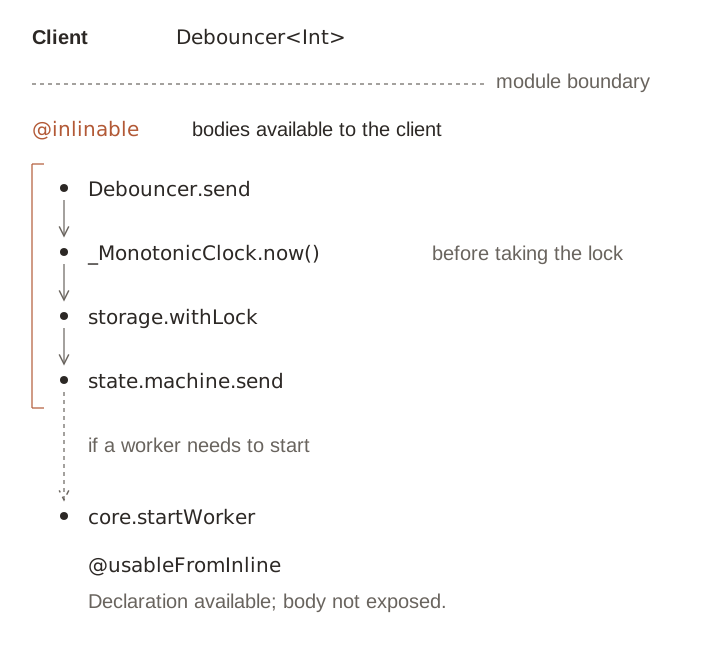
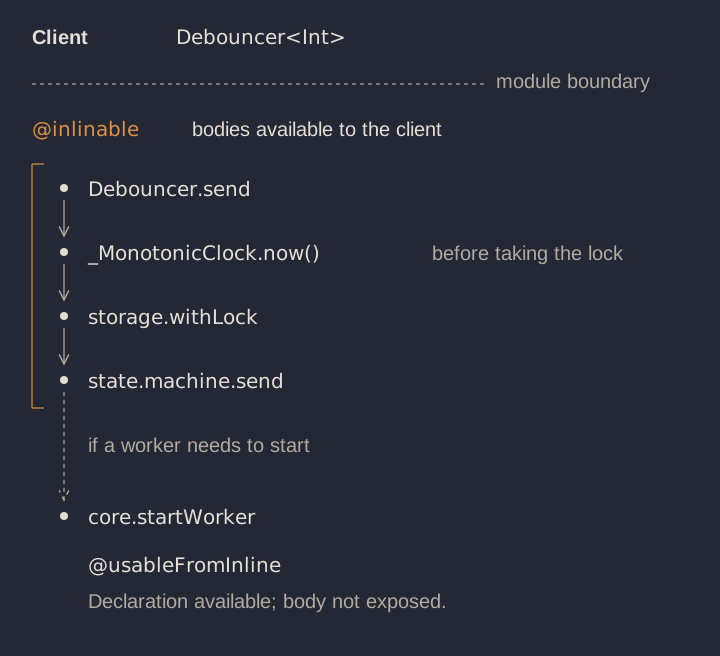
The input path and its helper declarations. These bodies are available to client optimization; the diagram does not assert which transformations the compiler chose.
Internal declarations used by an inlinable body need to be accessible through the binary interface. @usableFromInline provides that access without making them ordinary public Swift API. It also does not expose a function body for optimization by itself. Worker creation uses this narrower visibility because most sends in a burst never take that branch.
Follow the inlinable path through storage and the state machine
The revised prototype’s saved profile included these symbols:
FastDebounce.emit(value:)
closure #1 in FastDebounce.emit(value:)
type metadata accessor for Optional
__swift_instantiateGenericMetadata
swift_getGenericMetadata
mach_continuous_time
The storage helper lets the optimizer see how the closure accesses the protected state:
@inlinable
@inline(__always)
func withLock<Result>(_ body: (inout State) -> Result) -> Result {
    withUnsafeMutablePointers { statePointer, lockElements in
        let lock = lockElements + Self.lockIndex

        _lock(lock)
        defer {
            _unlock(lock)
        }

        return body(&statePointer.pointee)
    }
}
The lock helpers expose their platform branches too. The state machine then replaces the optional payload and extends the deadline. This excerpt of _DebounceMachine.send focuses on an active burst:
@inlinable
mutating func send(_ value: Value, now: UInt64) -> Bool {
    let newDeadline = _deadline(after: now, adding: interval)

    if let currentDeadline = burstDeadline, now < currentDeadline {
        burstDeadline = max(currentDeadline, newDeadline)

        if edges.contains(.trailing) {
            trailingValue = value
        }
    } else {
        // Start a new burst (omitted).
    }

    if isWorkerActive {
        return false
    }

    isWorkerActive = true
    return true
}
The max preserves the later deadline when concurrent callers read their clocks before locking and enter the critical section in a different order.
Worker creation is @usableFromInline, without @inlinable:
@usableFromInline
func startWorker(_ state: inout _PacerState<Machine>) {
    let previousWorker = state.worker
    let generation = state.generation

    state.worker = Task {
        await previousWorker?.value
        await self.run(generation: generation)
    }
}
Waiting for previousWorker preserves serial execution even if a cancelled predecessor has not returned. The package tests that case with an action that ignores cancellation until released.
Publishing bodies has a maintenance cost. Clients of a binary library may retain an older inlined implementation after the library changes, and @usableFromInline declarations become ABI commitments. A source package rebuilt with the application has a different deployment model. Swift’s library-evolution guide covers these obligations.
Moving the lock made its benchmark worse and the debouncer better
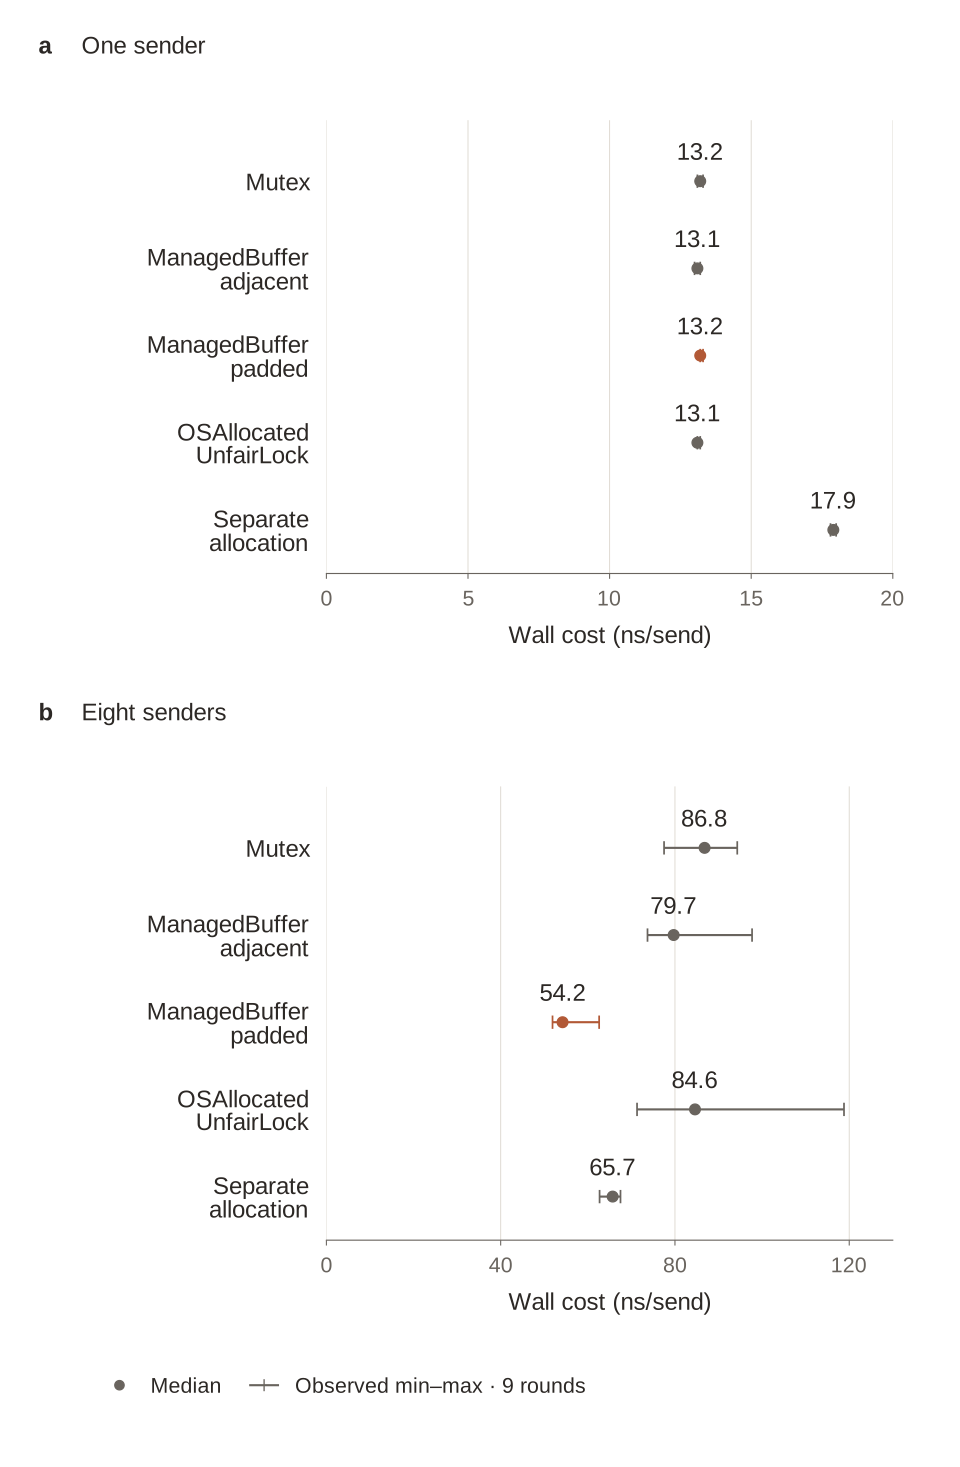
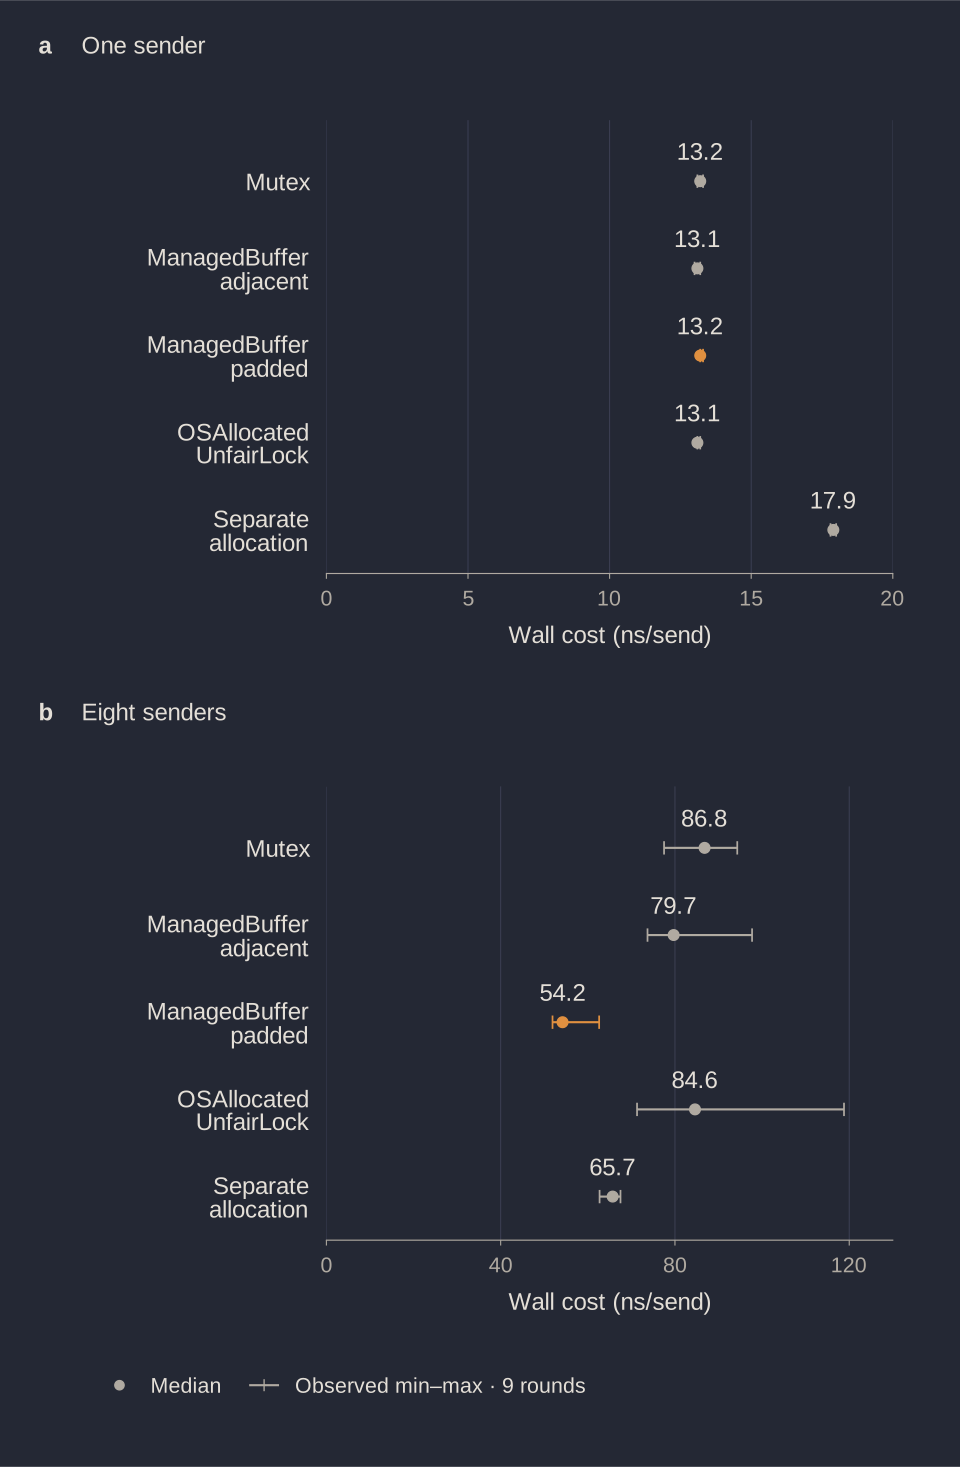
Once the repeated-input path was cheaper, I compared ways to store its lock and state. In a simplified debouncer benchmark with eight senders, moving the lock farther from the state reduced the complete operation from 79.7 to 54.2 ns. The isolated lock test went the other way, from 24.9 to 37.1 ns.
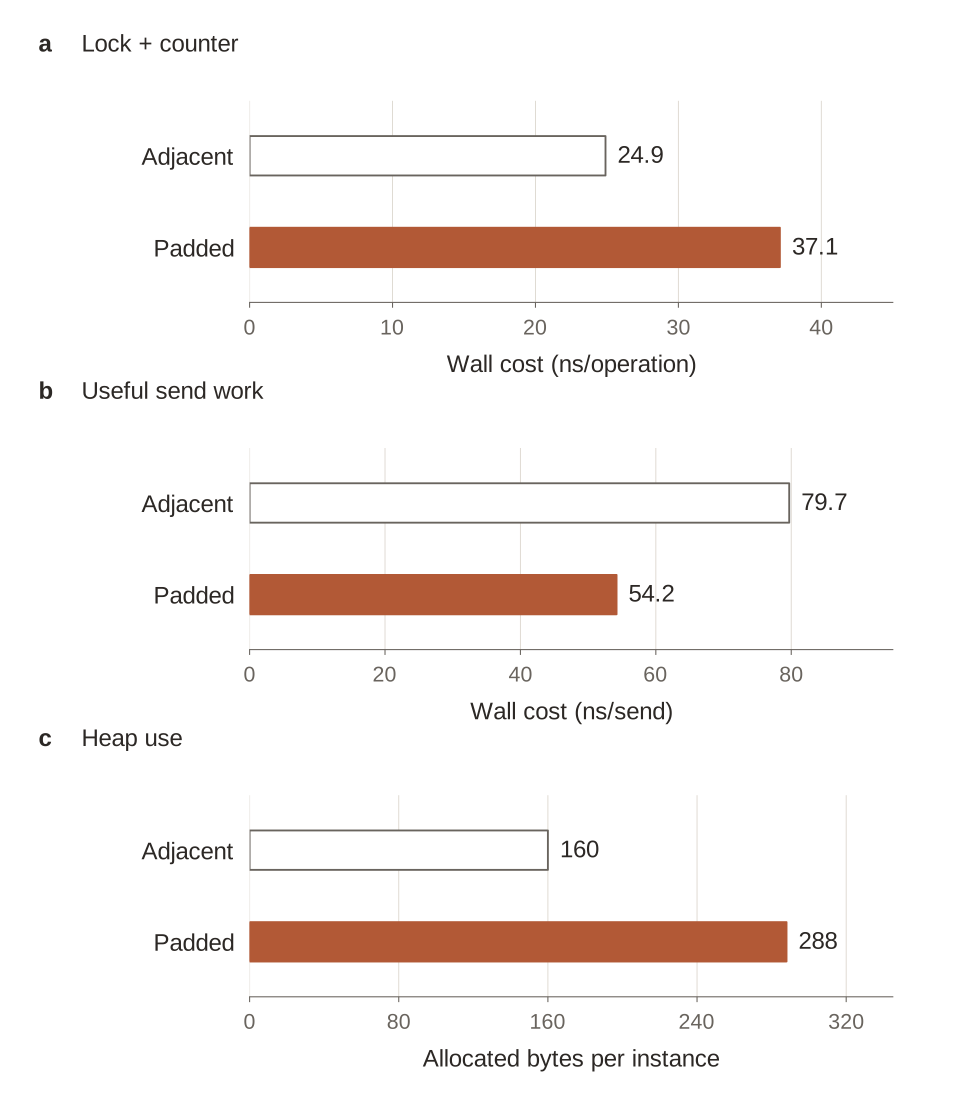
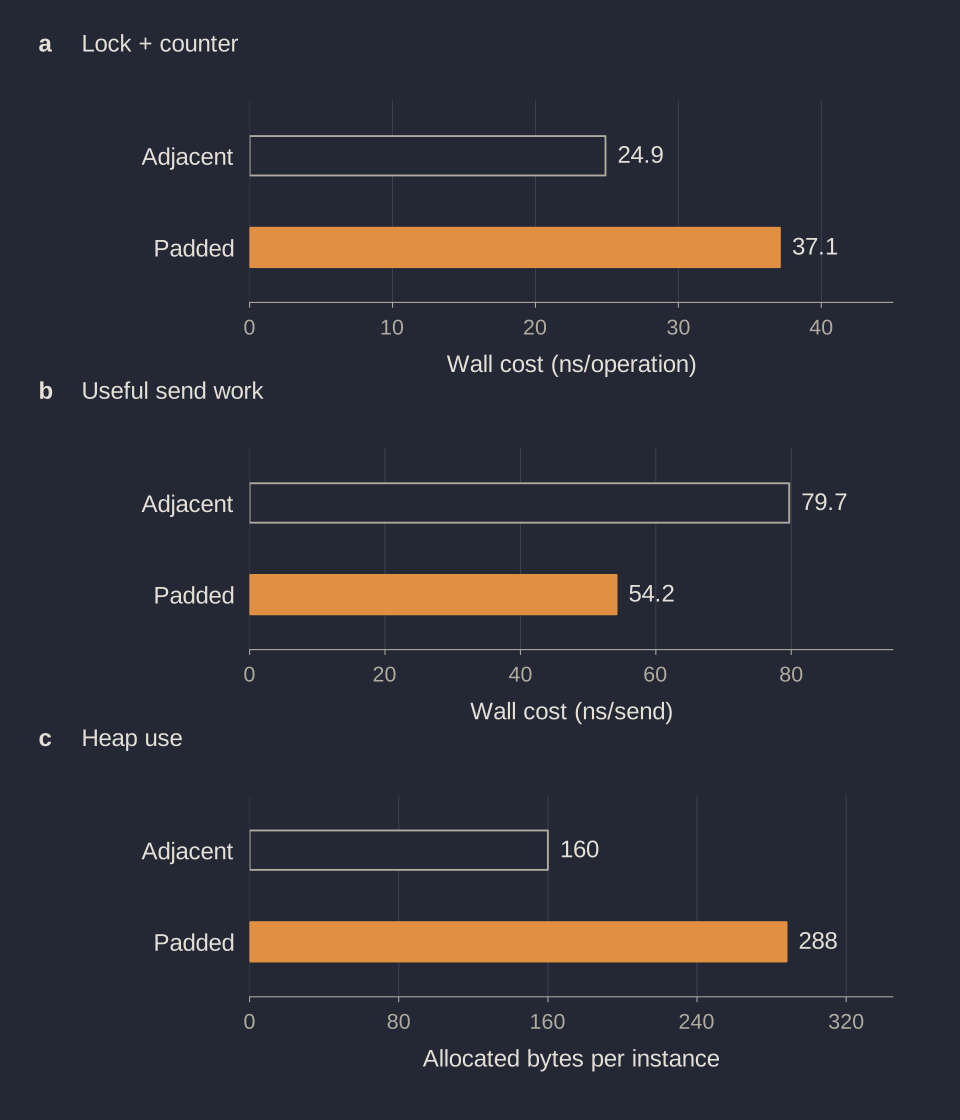
Storage experiment: median aggregate wall cost with eight threads, across nine interleaved rounds. Padding adds 128 measured heap bytes per instance. This uses a simplified debouncer with interchangeable storage, separate from the opening benchmark.
If I had chosen a layout from the raw-lock test alone, I would have rejected the one that helped the state update.
Keeping one allocation while moving the lock
My starting point used ManagedBuffer: the state lived in its header and the lock at the beginning of its element area. This kept both in one allocation. Allocating the lock separately was slower with one sender, yet faster with competing senders. I wanted to see whether increasing the distance between lock and state would help without adding an allocation.
I kept the single allocation and reserved space before the lock:
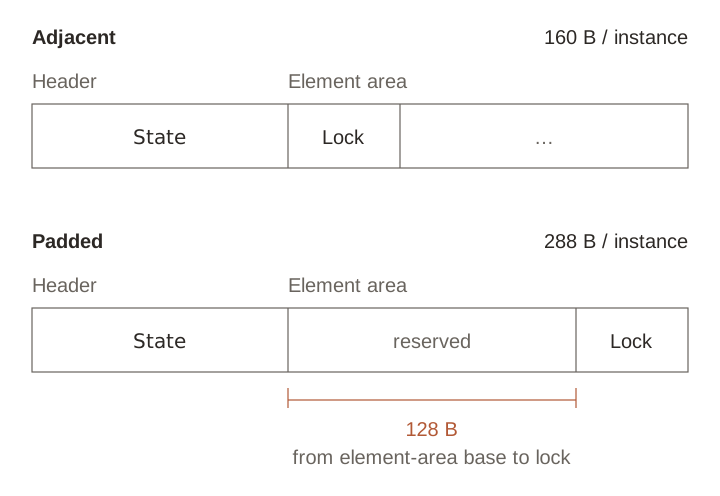
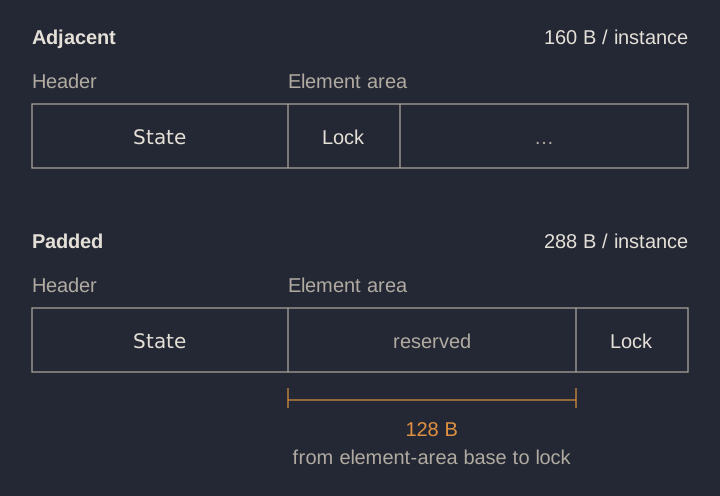
Adjacent and padded storage. The offset starts at the element-area base. The drawing shows pointer placement rather than physical cache-line boundaries.
The package computes an element index that reserves at least 128 bytes before the lock:
@inlinable
@inline(__always)
static var lockIndex: Int {
    let paddingBytes = 128
    let lockStride = MemoryLayout<_PlatformLock>.stride

    return (paddingBytes + lockStride - 1) / lockStride
}
It allocates lockIndex + 1 elements and accesses the lock at lockElements + lockIndex. The state remains in the header, and the lock primitive stays the same.
Inspect the padded storage initializer
The prototype initializer shows the two changes from adjacent storage: capacity grows from 1 to lockIndex + 1, and initialization moves from lockElements to lockElements + lockIndex.
@inlinable
public init(_ initial: sending Wrapped) {
    let buffer = Storage.create(minimumCapacity: Self.lockIndex + 1) { newBuffer in
        newBuffer.withUnsafeMutablePointerToElements { lockElements in
            let lock = lockElements + Self.lockIndex
            lock.initialize(to: os_unfair_lock_s())
        }

        return initial
    }

    storage = unsafeDowncast(buffer, to: Storage.self)
}
The prototype uses 128 / MemoryLayout<os_unfair_lock_s>.stride. The package’s version rounds upward for the platform lock’s stride, as shown above. Its locking helper uses the same index when acquiring and releasing the lock.
The 128-byte spacing is an implementation choice, not a universal cache-line size for Apple processors. Apple’s architecture guidance advises querying platform properties. The generic state’s size and allocation alignment still affect the surrounding addresses.
Why separating them might help
Cores coordinate memory access at cache-line granularity. A core holding the lock writes the state, while another core accesses the lock word. If those locations share a line, traffic around the lock can interfere with the line containing the owner’s state. Separating the fields can reduce that interference, although the threads still contend for the same lock and pass ownership of the protected state between them.
The Linux kernel documents this lock-and-data false-sharing pattern. That could explain these results, but I did not collect hardware counters to confirm whether coherence traffic caused the slowdown.
The two workloads also access different amounts of state. The raw-lock test increments one integer. The debouncer updates a payload, deadline, and worker bookkeeping. A layout that helps that larger operation need not help the counter increment.
View data: Storage wrapper comparison
Send columns show median [minimum–maximum] across nine rounds.
| Storage for the simplified debouncer | Send, one thread (ns) | Send, eight threads (ns) | Raw lock, eight threads | Heap per instance |
|---|---|---|---|---|
Synchronization.Mutex | 13.2 [13.1–13.3] | 86.8 [77.5–94.3] | 27.2 ns | 128 B |
ManagedBuffer, adjacent lock | 13.1 [13.0–13.2] | 79.7 [73.7–97.7] | 24.9 ns | 160 B |
ManagedBuffer, padded lock | 13.2 [13.2–13.3] | 54.2 [51.9–62.6] | 37.1 ns | 288 B |
OSAllocatedUnfairLock | 13.1 [13.1–13.2] | 84.6 [71.3–118.8] | 23.6 ns | 160 B |
| Separate lock allocation | 17.9 [17.8–18.0] | 65.7 [62.7–67.5] | 38.4 ns | 144 B |
Five storage wrappers, nine interleaved rounds after warm-up. Bars show medians and observed min–max. One-thread samples send two million values; contended samples use eight threads with 100,000 values each. Both use a 20 ms quiet period. Contended costs divide aggregate wall time by all sends.
Padding kept single-thread cost near 13 ns and reduced the contended send cost by about 32%. The observed ranges were 73.7–97.7 ns for adjacent storage and 51.9–62.6 ns for padded storage, so the improvement held across all nine rounds.
It also raised measured heap use from 160 to 288 bytes per instance. I kept the padded layout in the package, but the extra space may be harder to justify in an application with many mostly idle debouncers.
Storage measurement details
The simplified BoxedDebounce uses the same algorithm with five interchangeable wrappers. The separate-allocation variant measured 17.9 ns with one sender versus 13.1 ns for adjacent storage, but 65.7 versus 79.7 ns with eight senders. Padding retained the cheaper single-thread result while improving the contended case further.
Aggregate CPU cost also fell, from 602.8 to 405.3 ns per send. The raw-lock workload performs 250,000 counter increments per thread. The heap measurement uses malloc’s in-use delta across 100,000 retained instances, after reserving the array that holds them.
What 50× faster means for the caller
The completed package reuses its worker, stores integer deadlines, exposes the input path to the optimizer, and uses the padded storage layout. Together, those changes produced the 16 ns per send result in the opening comparison.
Burst size matters. With 1,000 inputs, the package measured 41 ns per send instead of 16 ns for 100,000. The cost of starting a worker spreads across fewer calls.
With paced input, the largest CPU difference was between the two task strategies. In the synthetic 200-event stream with 5 ms between inputs, total CPU was 31.10 ms for task per value, 21.65 ms for the original worker-based version, and 21.22 ms for the package. A separate no-debouncer run used 19.94 ms; those totals are not baseline-subtracted.
How send cost and process CPU were measured
The scenario harness records separate windows for sending, receiving the output, and letting cancelled tasks settle:
let beforeSending = ProcSnapshot.now()

for value in 0..<sendCount {
    debouncer.emit(value: value)
}

let afterSending = ProcSnapshot.now()

let deliveredValue = await sink.waitFirst()
let afterDelivery = ProcSnapshot.now()

await settle()
let afterSettling = ProcSnapshot.now()

withExtendedLifetime(debouncer) {}
Send cost uses afterSending.wall - beforeSending.wall, divided by sendCount. Total CPU uses afterSettling.cpu - beforeSending.cpu, including a 30 ms settling period. The harness checks that the final input was the single delivered value.
I added withExtendedLifetime after encountering an object-lifetime problem in a release build. Swift can release an object after its last use, before the closing brace of its scope. The call keeps the debouncer alive while the harness waits for its async result.
Callback lateness stayed on the millisecond scale
Reducing the work in send leaves the requested quiet period unchanged. After sleeping, the worker still needs to resume and reach the action through its executor.
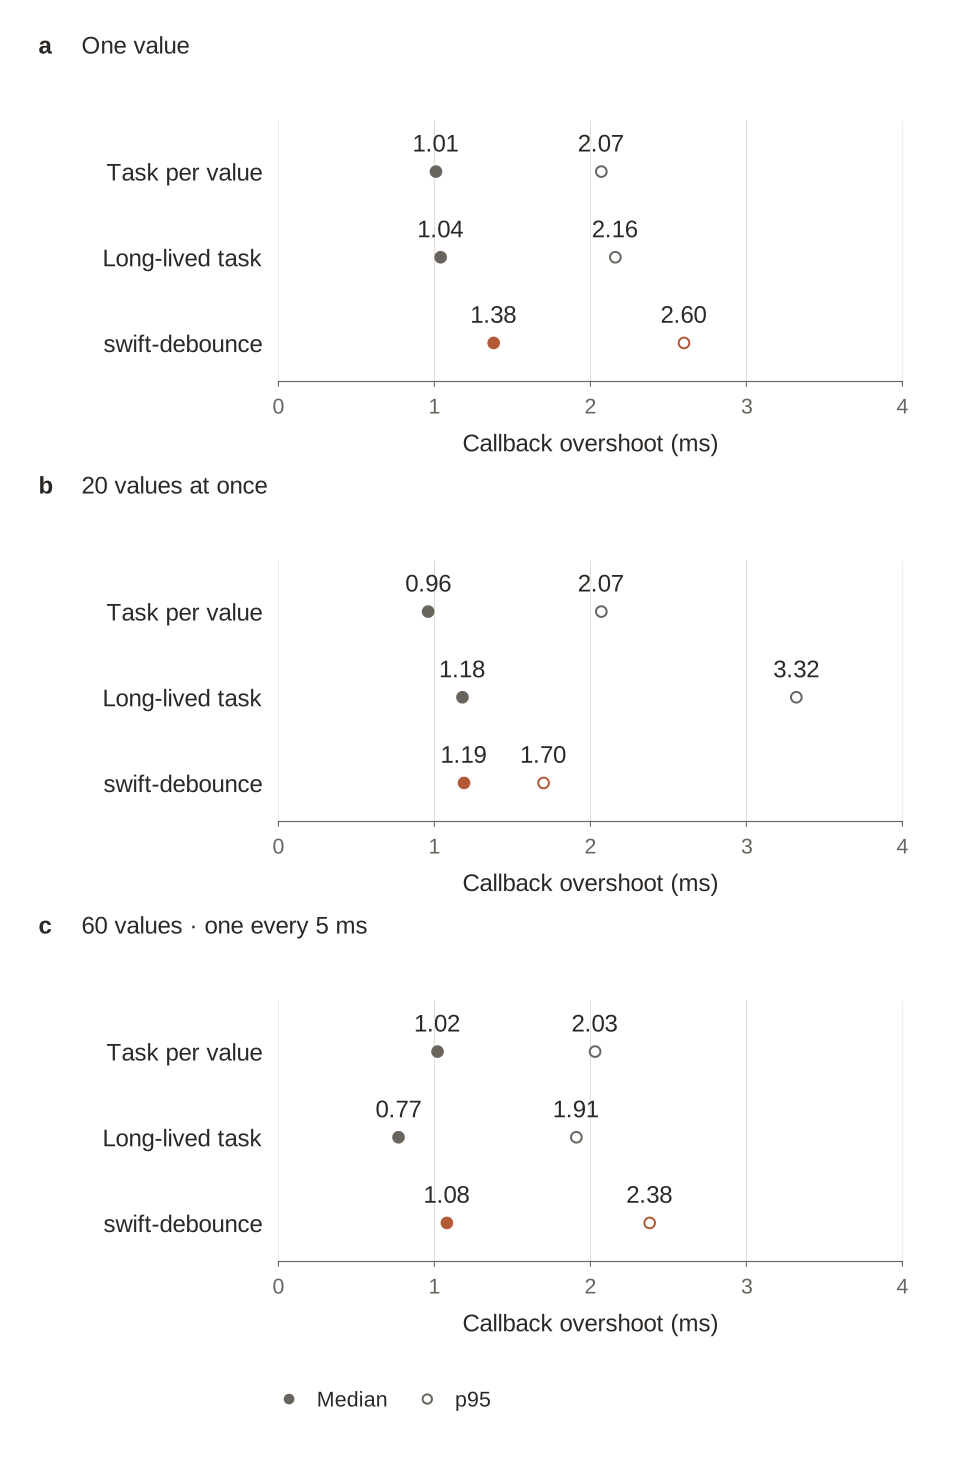
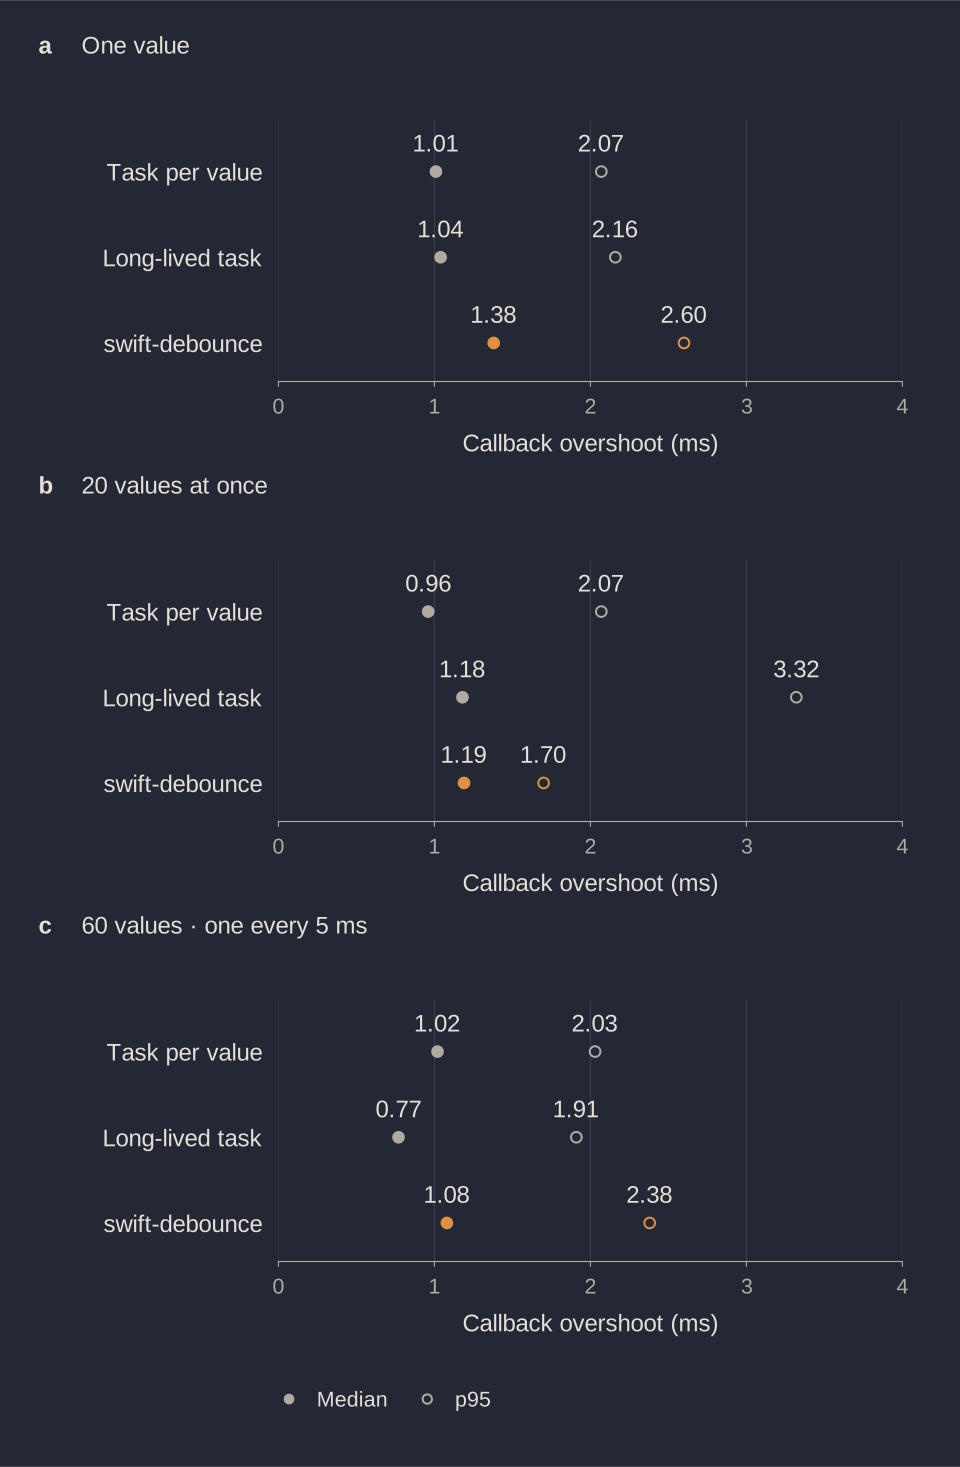
I measured callback lateness with a focused harness and a 50 ms quiet period. It timestamps the callback and measures the delay beyond the requested 50 ms after the last send:
View data: Callback overshoot comparison
| Input pattern | Implementation | Median (ms) | p95 (ms) |
|---|---|---|---|
| One value | Task per value | 1.01 | 2.07 |
| One value | Original worker-based | 1.04 | 2.16 |
| One value | Package | 1.38 | 2.60 |
| 20 values at once | Task per value | 0.96 | 2.07 |
| 20 values at once | Original worker-based | 1.18 | 3.32 |
| 20 values at once | Package | 1.19 | 1.70 |
| 60 values, one every 5 ms | Task per value | 1.02 | 2.03 |
| 60 values, one every 5 ms | Original worker-based | 0.77 | 1.91 |
| 60 values, one every 5 ms | Package | 1.08 | 2.38 |
Median and p95 callback overshoot, 30 interleaved bursts per pattern on the same M1 Max release environment. The paced case is a synthetic 200 Hz stream, not typical typing.
The latency ranking changed with the input pattern. The package’s median overshoot was higher for one value and close to the original worker-based version for 20 values. Its medians across the three patterns were 1.38, 1.19, and 1.08 ms. There was no improvement comparable to the fiftyfold reduction in input cost.
Those delays combine timer, scheduling, and executor effects. For a high-volume source, spending less CPU accepting values can be useful even when delivery timing stays in the same range. For a search field, the dense-burst headline says little about how responsive the UI will feel.
How callback lateness was measured
The focused harness timestamps the callback itself. It subtracts the timestamp taken immediately after the last send, then subtracts the requested 50 ms:
let fireTime = FireTime()
let debouncer = make(.milliseconds(50), fireTime.record)
var lastSendTime: UInt64 = 0

for value in 0..<sends {
    if let cadenceMs {
        let pauseNanoseconds = cadenceMs * 1_000_000
        try? await Task.sleep(nanoseconds: pauseNanoseconds)
    }

    debouncer.emit(value: value)
    lastSendTime = now()
}

while fireTime.value.load(ordering: .relaxed) == 0 {
    try? await Task.sleep(nanoseconds: 1_000_000)
}

withExtendedLifetime(debouncer) {}

let callbackTime = fireTime.value.load(ordering: .relaxed)
let elapsedMilliseconds = Double(callbackTime - lastSendTime) / 1_000_000
return elapsedMilliseconds - 50
The polling loop waits for the recorded timestamp; its wakeup does not define the callback time. Rotating implementation order across rounds reduces dependence on which runs first. This differs from measuring first-input-to-output time, which also includes feeding the burst.
Long-running actions are another trade-off
Side Effect’s state machine returns to .idle before awaiting its output. New input can therefore start another worker while an earlier action is still running. The package keeps one action active at a time; pending input may wait for that action even after its own quiet period expires.
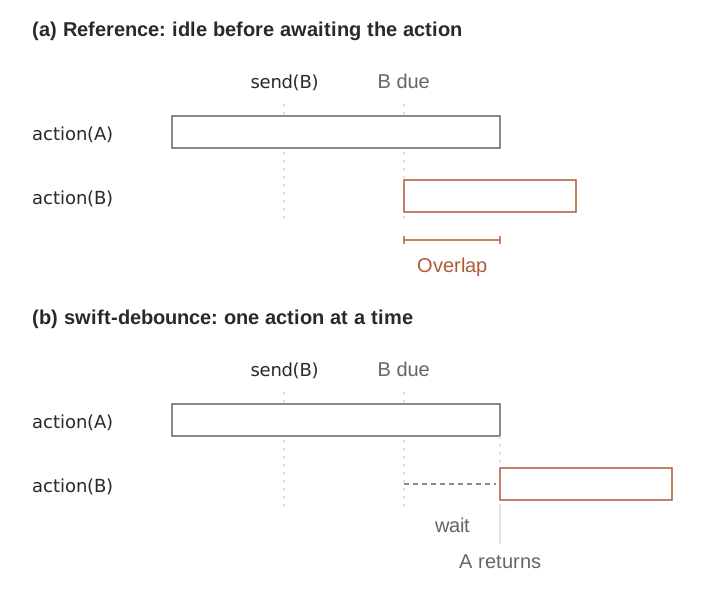
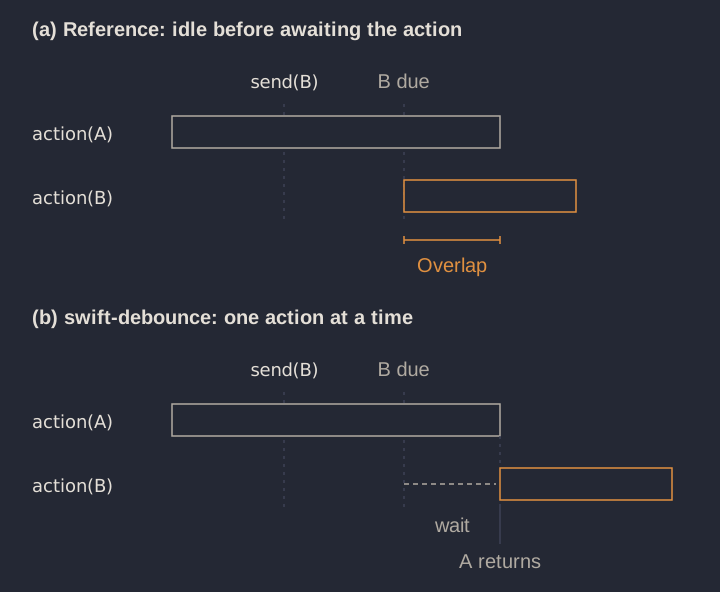
Side Effect’s action ordering compared with the package’s worker loop. Action lengths illustrate the two policies.
Follow the action policy with virtual time
In this test, machine() creates a trailing debouncer with an interval of 100 abstract ticks. Value a arrives at 0 and becomes due at 100. Values b and c arrive while its action runs:
@Test
func valueSentWhileActionRunsWaitsForTheQuietPeriod() {
    var stateMachine = machine()

    _ = stateMachine.send("a", now: 0)
    #expect(stateMachine.next(now: 100) == .run("a"))

    // New values arrive while the action for "a" is running.
    #expect(stateMachine.send("b", now: 120) == false)
    #expect(stateMachine.send("c", now: 130) == false)

    // The action returns, but "c" still needs its full quiet period.
    #expect(stateMachine.next(now: 150) == .sleep(until: 230))
    #expect(stateMachine.next(now: 230) == .run("c"))
    #expect(stateMachine.next(now: 240) == .exit)
}
Both later sends return false because a worker already exists. At tick 150, action a has returned, but the last input arrived at 130. The worker waits another 80 ticks before delivering c.
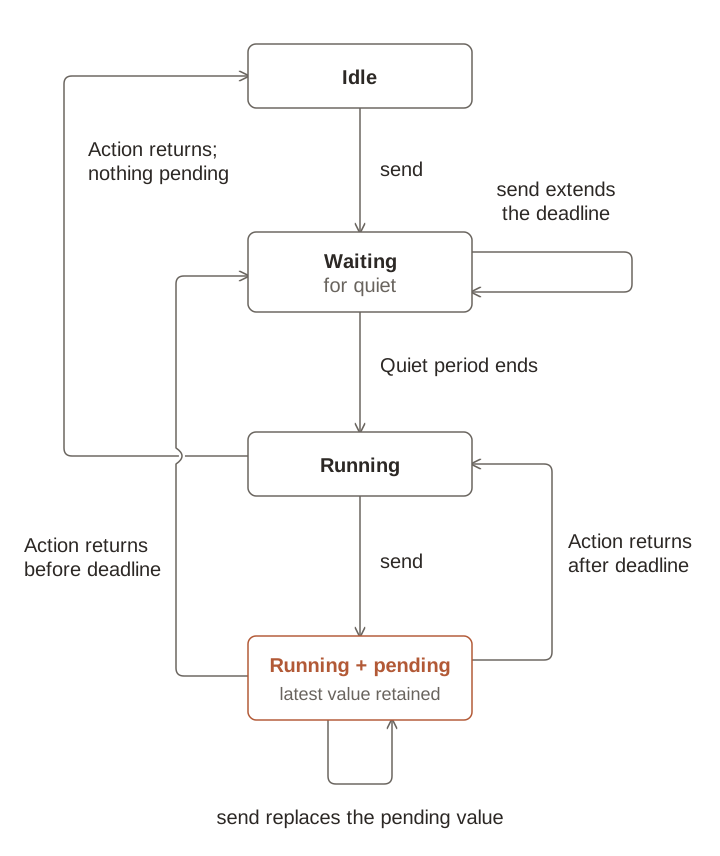
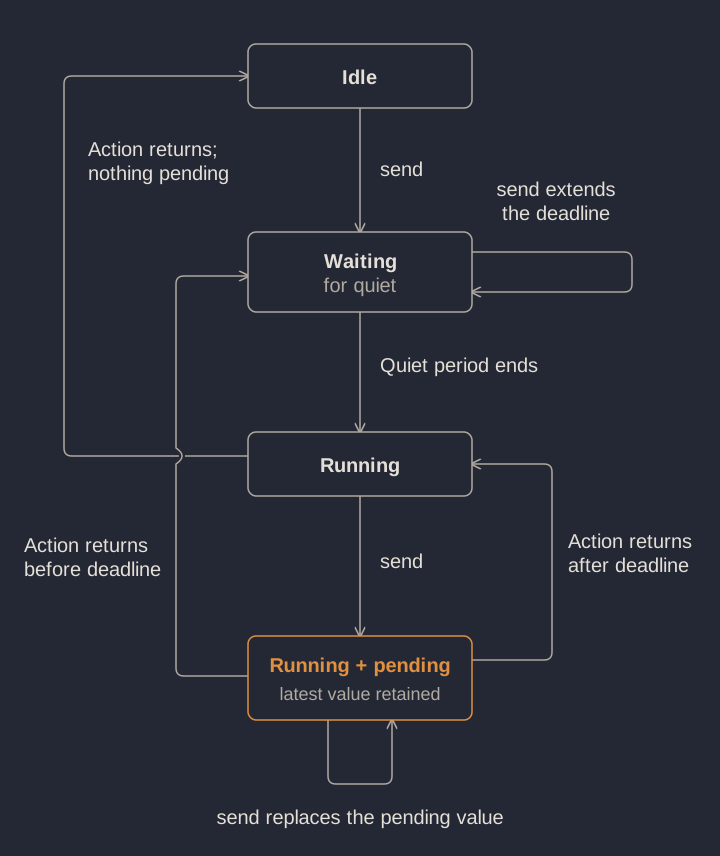
State machine and worker behavior for trailing debounce. The diagram omits cancellation and summarizes behavior rather than stored fields.
The worker does not call next during an action. The machine chooses the next operation; the worker enforces the ordering.
What I would measure next time
Next time I see runtime metadata in a hot path, I’ll check what the compiler knows about each type’s layout and which generic bodies it can see. And when I compare locks or storage wrappers, I’ll include the protected operation from the start. In this case, the counter-increment benchmark would have led me to choose the slower debouncer layout.
I packaged the implementation as swift-debounce, with a shared engine for debounce and throttle and SwiftUI integration. The benchmark guide has reproduction commands and other workloads; the getting-started guide covers usage.
Thanks for reading!